
Foreword
As I continue my journey into reverse engineering macOS and iOS applications, I'm currently focusing on ARM assembly. I'm also working on a follow-up to my previous post on reverse engineering. In this next post, I'll be tackling the challenge of cracking a macOS app's license, and since I'll be dealing with a release build, assembly language will be essential.
However, during my research, I stumbled upon something that completely changed my focus! While watching a video by Christopher Lopez, I was introduced to the concept of anti-debugging.
This concept blew my mind, as every new security concept tends to do! Since the video didn't delve into the details, I decided to create a practical example to better understand it—and, of course, to share my findings with you :)
In a way, it was a good excuse to practice my ARM skills.
Anti debugging: the concept
As we saw in the previous post about reverse engineering a macOS application we can use a debugger to dynamically reverse-engineer! So, in theory, if I can prevent a debugger from attaching my application I can avoid an anyone to inspect my application. I said in theory, because by the end of this post we'll show how to detect and bypass this kind of mechanism.
This what anti-debugging is, in a nutshell! Let see how we could accomplish that.
Using fork
There are several ways to achieve this goal! I found a list of it in the Mobile Application Security Testing Guide. The post explain mechanisms and how to detect them! The approach we'll use here is not covered in the guide.
Note: the later link is focus on iOS and not macOS!
In this post, I'll focus on the "fork" approach! The mechanism is simple: when the process is launched, it will be immediately forked. Then the parent will be exited and only the child will continue.
+---------------------+
| Start Process       |
| (Parent)            |
+---------------------+
          |
          v
+---------------------+
| Fork Process        |----+
| (Parent forks Child)|    |
+---------------------+    |
          |                |
          v                |
+---------------------+    | (Parent exits)
| Child Process       |<---+
| Continues Execution |
+---------------------+
You see what it means? When the debugger, LLDB for instance, will attach to the process, it will attach the parent that will exit!
Practical example using C
For the first iteration of this post, we'll use C:
#include <dlfcn.h>
#include <stdio.h>
#include <unistd.h>

typedef int (*fork_func_t)(void); // #1

int main() {
  printf("start process pid: %d\n", getpid()); // #2

  fork_func_t fork = dlsym(RTLD_DEFAULT, "fork"); // #3
  if (NULL == fork) {
    printf("fork symbol not found!\n");
    return 1;
  }

  int pid = fork(); // #4
  if (pid != 0) {
    if (pid > 0) {
      printf("exit parent process\n"); // #4.1
    }
    if (pid == -1) {
      printf("fork failed\n"); // #4.2
    }
    return 0;
  }

  printf("continue execution for pid`: %d\n", getpid()); // #5
  return 0;
}
If you run this program (I let all instruction to do it, in the GitHub repository), you should see:
❯ ./antidebug
start process pid: 44970
exit parent process
continue execution for pid`: 44971
Now let's dive into the source code and give detail for each pointers:
-
This line declares a function pointer type named
fork_func_t. Thistypedefwill be used to cast the result ofdlsymto the correct function type. -
This line prints the Process ID (PID) of the current process.
-
This line uses
dlsymto dynamically load theforkfunction.RTLD_DEFAULTtellsdlsymto search for the symbol in the default symbol scope. The result is cast to thefork_func_ttype we defined earlier. -
This line calls the dynamically loaded
forkfunction. The return value offorkis stored inpid.4.1. This message is printed if
pid > 0, indicating we're in the parent process. The parent process will exit after this.4.2. This message is printed if
pid == -1, indicating that the fork operation failed. -
This line is only reached in the child process (when
pid == 0). It prints the PID of the child process, which will be different from the original PID.
Open it in LLDB
Let's try to attach LLDB to the program:
❯ lldb ./antidebug
(lldb) target create "./antidebug"
Current executable set to '/Users/../anti-debug/c/build/antidebug' (arm64).
Now, type run to execute the program:
(lldb) run
Process 85527 launched: '/Users/../anti-debug/c/build/antidebug' (arm64)
start process pid: 85527
exit parent process
continue execution for pid`: 85530
Process 85527 exited with status = 0 (0x00000000)
Now we'll try to take a deeper look at the mechanism it self: how could we detect it, and how could we bypass it.
dlsym
Why using dlsym rather than directly fork?
The main reason for using dlsym instead of calling fork directly is to make it harder for an 'attacker' to detect or set breakpoints on the fork function, thus obfuscating the anti-debugging mechanism. You have to more checks before being able to understand why you cannot attach the debuger.
Now that you know the mechanism, we should take a look at how to detect this anti debugging pattern.
Detection
You can load the binary in a disassembler tool like Hopper. Then I could look for fork string in
the binary:
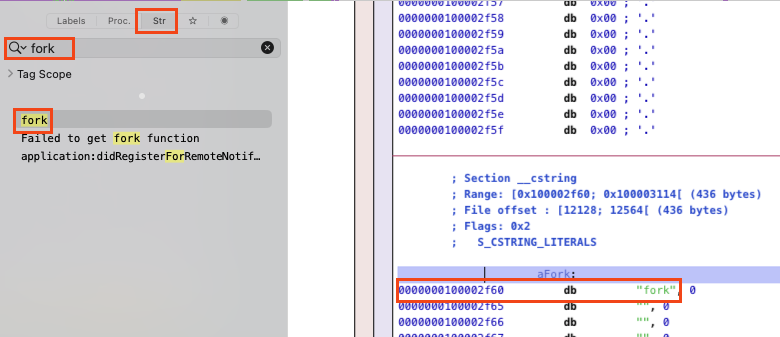
Now we know the string "fork" is located at: #0x100002f60
I assume that a lot of disassembler offer the same capabilities, here we will ask Hopper to for
assembly that reference 0x100002f60:
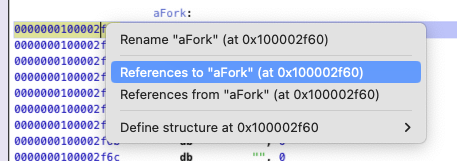
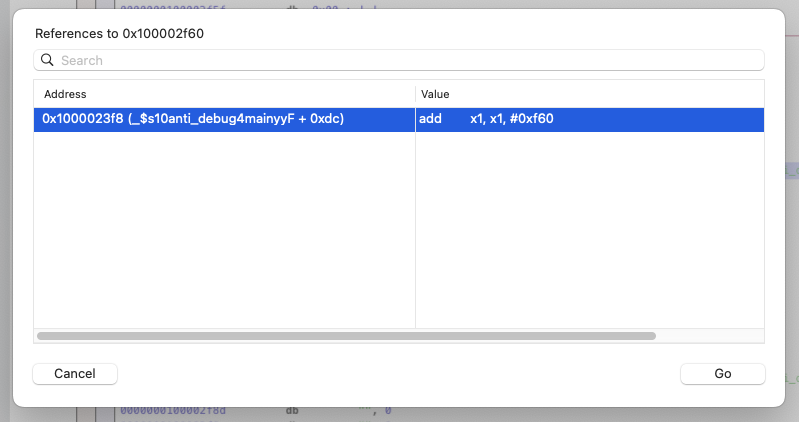
Now we have a view on where the "fork" string is used!
0000000100003e24         movn       x0, #0x1
0000000100003e28         adrp       x1, #0x100003000
0000000100003e2c         add        x1, x1, #0xf47              ; HERE!
0000000100003e30         bl         imp___stubs__dlsym
0000000100003e34         str        x0, [sp, #0x20 + var_10]
0000000100003e38         ldr        x9, [sp, #0x20 + var_10]
0000000100003e3c         movz       x8, #0x0
0000000100003e40         subs       x8, x8, x9
0000000100003e44         cset       w8, ne
0000000100003e48         tbnz       w8, 0x0, loc_100003e68
But how could I be sure that this code is dlsym(RTLD_DEFAULT, "fork"); ?
Note: Generally speaking a disassembler will wrote comments to help you reading the ARM but for the sake of the tutorial I get rid of it.
Now let's take a look at how "fork" is used.
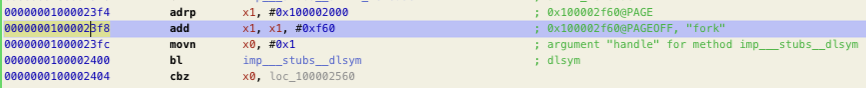
x1
The instruction 0000000100003e2c is couple to the previous one 0000000100003e2c:
0000000100003e28         adrp       x1, #0x100003000
0000000100003e2c         add        x1, x1, #0xf47              ; HERE!
Here, it loads the page #0x100003000 (adrp) so the register x1 is equal to
#0x100002000 which is the start of the page! Then we add an offset (add) of #0xf47.
On the end x1 is set 0x100003f47 which is the address of "fork" as we saw in the first screenshot.
Fun fact, in ARM, x1 is often used as the second argument of a function. Now you can guess how the register x0 will be used:
x0
0000000100003e24 movn x0, #0x1
This instruction uses movn to set x0 to ~1, which is the bitwise negation of 1. In a 64-bit
register, this results in x0 being set to 0xFFFFFFFFFFFFFFFE, which is -2 in signed decimal.
This value is used as RTLD_DEFAULT here. You can confirm this by checking the dlcfn.h file:
#define	RTLD_NEXT	((void *) -1)
#define	RTLD_DEFAULT	((void *) -2)
#define	RTLD_SELF	((void *) -3)
#define	RTLD_MAIN_ONLY	((void *) -5)
The next instruction is a bl.
bl
bl is an instruction that means "Branch with Link." Think of it as a way to call a function. When
you call a function, your program jumps to another part of the code, runs that function,
and then comes back to where it left off.
imp___stubs__dlsym: This is a placeholder, or a stub. A stub is a small piece of code that
eventually leads to the real function.
Note: Because dlsym is dynamically linked, the actual address of dlsym is not known at compile time. Instead, the instruction branches to a stub (imp___stubs__dlsym) that eventually resolves to the real dlsym function address at runtime.
After dlsym call
The instructions following the dlsym call handle its return value:
0000000100003e34         str        x0, [sp, #0x20 + var_10]
0000000100003e38         ldr        x9, [sp, #0x20 + var_10]
0000000100003e3c         movz       x8, #0x0
0000000100003e40         subs       x8, x8, x9
0000000100003e44         cset       w8, ne
0000000100003e48         tbnz       w8, 0x0, loc_100003e68
These instructions ultimately set w8 based on whether the return value from dlsym is non-zero.
If w8 is non-zero, the program will branch to loc_100003e68, otherwise it continues execution normally.
Let's delve into loc_100003e68:
                     loc_100003e68:
0000000100003e68         ldr        x8, [sp, #0x20 + var_10]
0000000100003e6c         blr        x8
0000000100003e70         str        w0, [sp, #0x20 + var_14]
0000000100003e74         ldr        w8, [sp, #0x20 + var_14]
0000000100003e78         subs       w8, w8, #0x0
0000000100003e7c         cset       w8, eq
0000000100003e80         tbnz       w8, 0x0, loc_100003ed8
At loc_100003e68, the program handles the fork function call and its return value.
Here, the address of fork is loaded into x8, and the blr instruction calls fork. The
return value from fork is stored in w0, then checked: if it's 0, indicating the child process,
w8 is set to 1 and execution continues; otherwise, the program may branch to loc_100003ed8,
depending on the return value.
Bypass
In the previous section, we observed that the program can branch to loc_100003ed8 based on the result of the fork call. Upon examining loc_100003ed8, we notice that it contains code to print "continue execution for pid: %d\n", indicating successful continuation.
This suggests that if we skip the fork call and manipulate the w8 register appropriately, we can bypass the anti-debugging mechanism entirely.
Patch the binary
To achieve this, we can apply the following patch:
0000000100003e68  ldr  x8, [sp, #0x20 + var_10]     ; Load the fork function pointer (skipped by the nop)
0000000100003e6c  nop                               ; Skip the fork call
0000000100003e70  nop                               ; No operation (no need to change w0)
0000000100003e74  mov  w8, #0                       ; Force w8 to 0
0000000100003e78  subs w8, w8, #0x0                 ; Subtract 0 from w8 (remains 0), sets Z flag since result is 0
0000000100003e7c  cset w8, eq                       ; Set w8 to 1 if the Zero flag (Z) is set, i.e., if w8 == 0
0000000100003e80  tbnz w8, 0x0, loc_100003ed8       ; Branch to loc_100003ed8 if bit 0 of w8 is 1 (w8 == 1 here)
I added comments for each instruction to explain the behavior and how the patch bypasses the anti-debugging mechanism.
By applying this patch, we effectively skip the fork call and force the program to behave as if it is in the child process. This causes the program to continue execution without triggering the anti-debugging branch, thereby bypassing the mechanism entirely.
Let's test it:
❯ ./anti_debug_fixed
start process pid: 13057
continue execution for pid`: 13057
TADA!