
Foreword
In the previous post, I used dlsym to fork the process and avoid the debugger to be able to attach
it. While reading comments, people highlighted that I could use follow-fork mode in LLDB and GDB.
It pushed me to try other mechanisms and see how I could bypass them using reverse-engineering techniques. My attempt is to see if there is a more robust approach.
Bye-bye fork!
The first thing I could do to avoid follow-fork mode is to avoid to fork!
But where can I go?
When I shared the previous post on Hacker News, someone in the comment section mentioned ptrace.
I already saw this somewhere. Let's do a quick refresh by typing man 2 ptrace.
Note: Ptrace is not fully implemented on macOS. For instance you cannot inject code like you can do on Linux.
Hello ptrace
This system library provides a utility function which allows one process to control another one.
As the manual is not always pleasant to read, I'll try to summarize what I found essential.
int ptrace(int request, pid_t pid, caddr_t addr, int data);There are four arguments, but the first one (request) is the most important as it will determine if
we need others or not.
There are a bunch of request we could perform, but the one we'll focus on is PT_DENY_ATTACH!
This request is used by the traced process to deny future traces by its parent. For this specific request the remaining three arguments are ignored.
Wait a minute! It means that the parent, LLDB or GDB in this case are using ptrace them self.
Let's verify!
Does LLDB uses PT_DENY_ATTACH?
It could be intresting to see which mechanism LLDB uses to attach the process.
Looking directly in the code could be cumbersome. Let's write a basic example, enable LLDB logs so we could see what is happening.
#include <stdio.h>

#include <sys/ptrace.h>

#include <unistd.h>


int main() {
  printf("Run in pid %d\n", getpid());
  printf("Check if debugger is attached\n");
  if (ptrace(31, 0, 0, 0) < 0) {
    perror("ptrace");
    return 1;
  }
  printf("Debugger is not attached!\n");
  printf("Run... \n");
  sleep(1000);
  return 0;
}
If you need, I wrote a CMake file here to build this translation unit.
Now, we have to use the LLDB_DEBUGSERVER_LOG_FILE environment variable to specify a path where
logs should be written.
$ export LLDB_DEBUGSERVER_LOG_FILE=./log.txt
Now, we can start our program (in the same terminal)...
❯ lldb ./ptrace_anti_debug
(lldb) target create "./ptrace_anti_debug"
Current executable set to '/Users/tonygo/temp/anti-debug/ptrace/build/ptrace_anti_debug' (arm64).
.. and run it:
(lldb) run
Process 58335 launched: '/Users/tonygo/temp/anti-debug/ptrace/build/ptrace_anti_debug' (arm64)
Run in pid 58335
Check if debugger is attached
Process 58335 exited with status = 45 (0x0000002d)
(lldb) quit
The first thing I note is that the process exit status is 45. I'll keep that in mind!
Now I'll try to filter logs with ptrace string:
❯ cat log.txt | grep ptrace(
[LaunchAttach] (58336) About to ptrace(PT_ATTACHEXC, 58335)...
[LaunchAttach] (58336) Completed ptrace(PT_ATTACHEXC, 58335) == 0
[LaunchAttach] (58336) Done napping after ptrace(PT_ATTACHEXC)'ing
[...]
I can confirm now that LLDB uses ptrace. Surprisingly, LLDB succeed in
attaching the pid 58335 which is the process ID of our program.
A few lines later in log.txt I find this line:
Attach succeeded, ready to debug.
Not so surprising in the end as at this stage, I did not type the run LLDB command. So there
is no ptrace(PT_DENY_ATTACH, ... call so far.
I can imagine that there is two steps here:
ptraceis called withPT_ATTACHEXC(in LLDB), which could set a flag somewhereptraceis called withPT_DENY_ATTACH(in my code), which check if the variable/flag and exit the program accordingly
Now I'll try to reverse engineer the ptrace system library to verify my hypothesis.
How ptrace works under the hood
I'll start from XNU sources, but querying ptrace.
There are a bunch of files, but there are two that interest me:
First, I noticed that the mach_process file is part of the BDS kernel. While the first one seems to be
related to the libsyscall we are using in user land. Let's start with that one.
ptrace syscall
We have a file full of assembly instructions ... The first thing I observe is that we have different implementation of the syscall, I'll try to read the arm64 one:
#elif defined(__arm64__)

MI_ENTRY_POINT(___ptrace)           ; #1
	MI_GET_ADDRESS(x9,_errno)         ; #2
	str		wzr, [x9]                   ; #2
	SYSCALL_NONAME(ptrace, 4, cerror) ; #3
	ret

#else
This is not obvious at first, but syscalls are, most of the time, wrappers around assembly. When we call the C API, behind the scene it will execute these instructions.
For instance, you can compile asm along C code using CMake and call the assembly directly from C.
In the assembly snippet above, the most important is that
- #1: It just adds the
___ptracelabel to this snippet and expose it for the linker (this logic is hidden in theMI_ENTRY_POINTpre-processor) - #2: It get the
errnoadress, set it to zero, this is a way to ensure that the state is clean before calling the syscall. - #3: It calls
ptracesyscall, by callingsvcwith the appropriate syscall number.
Note: when I took a look at symbols in my executable using
nm -gif found_ptraceand no___ptrace. It pushes me to check at thelibsystem_kernel.dylibto find
  ❯ nm -g /Users/tony/dyld-cache/usr/lib/system/libsystem_kernel.dylib | grep ptrace
  000000018040eedc T ___ptrace
  000000018040eedc T _ptrace
It seems that the compiler generated both :)
Now let's take a look at the code executed in the kernel mode.
ptrace kernel code
This is second file I shared earlier: https://github.com/apple-oss-distributions/xnu/blob/main/bsd/kern/mach_process.c#L118
Finally a bit of C haha! The first intresting part is here (I cleaned the code a bit for readability)
	if (uap->req == PT_ATTACHEXC) {        // #1
		uap->req = PT_ATTACH;                // #2
		tr_sigexc = 1;
	}
	if (uap->req == PT_ATTACH) {           // #2
		int             err, cb_err;

		err = kauth_authorize_process(kauth_cred_get(), KAUTH_PROCESS_CANTRACE,
		    t, (uintptr_t)&cb_err, 0, 0);

		if (err == 0) {
			/* it's OK to attach */
			proc_lock(t);
			SET(t->p_lflag, P_LTRACED);        // #3
This is the part of the code trigged by doing ptrace(PT_ATTACHEXC, ...) (like LLDB does)
- #1: The execution is branching for
PT_ATTACHEXC - #2: Then we re-set the request to
PT_ATTACHand branch to the next if - #3: Finally the
p_lflagis set toP_LTRACED
Now when I decide to run my executable in LLDB ptrace(PT_DENY_ATTACH, ...) is called:
	if (uap->req == PT_DENY_ATTACH) {             // #1
		proc_lock(p);
		if (ISSET(p->p_lflag, P_LTRACED)) {         // #2
			proc_unlock(p);
			KERNEL_DEBUG_CONSTANT(BSDDBG_CODE(DBG_BSD_PROC, BSD_PROC_FRCEXIT) | DBG_FUNC_NONE,
			    proc_getpid(p), W_EXITCODE(ENOTSUP, 0), 4, 0, 0);
			exit1(p, W_EXITCODE(ENOTSUP, 0), retval); // #3

			thread_exception_return();
			/* NOTREACHED */
		}
		SET(p->p_lflag, P_LNOATTACH);
		proc_unlock(p);

		return 0;
	}
- #1: The execution is branching for
PT_DENY_ATTACH - #2: Then we branch if
p_lflagis set toP_LTRACED(which is the case) - #3: Finally, we exit with
ENOTSUPstatus code (which is45)
Awesome! This explains why we saw:
Process 58335 exited with status = 45 (0x0000002d)
I know that curiosity is a bad trait, especially after hours of research, but I would like to see how it works, if I attach LLDB while my program is already running...
Attach the process during its run
First we need, to write logs into another file:
$ export LLDB_DEBUGSERVER_LOG_FILE=./log2.txt
Let's run the program directly this time:
❯ ./ptrace_anti_debug
Run in pid 20292
Check if debugger is attached
Debugger is not attached!
Run...
... and in another terminal:
❯ lldb -p 20292
(lldb) process attach --pid 20292
error: attach failed: lost connection lldb -p 20292
You can quit LLDB then:
(lldb) quit
Now, this is time to observe the content of log2.txt file.
Inspect LLDB log
First, I'll use grep to see what if we have something related to ptrace.
❯ cat log2.txt | grep ptrace
[LaunchAttach] (20295) About to ptrace(PT_ATTACHEXC, 20292)...
When I open the log file, to see what we have before/after:
[LaunchAttach] (58094) About to ptrace(PT_ATTACHEXC, 57618)...
114 +0.000025 sec [e2ee/1703]: MachTask::ExceptionThread ( arg = 0x145809268 ) starting thread...
[EOL]
We don't really have an exit code this time! Let's take a look at the source code!
In this case, ptrace(PT_DENY_ATTACH, ...) is called before ptrace(PT_ATTACHEXC, ...).
The first call of ptrace will set this flag:
SET(p->p_lflag, P_LNOATTACH);
Then when the second call of ptrace is happening:
/* not allowed to attach, proper error code returned by kauth_authorize_process */
if (ISSET(t->p_lflag, P_LNOATTACH)) {
	psignal(p, SIGSEGV);
}
goto out;
SIGSEGV means "Signal Segmentation Fault"! It probably explain why we have a different result!
Now when I think about it, the documentation said:
If the process is currently being traced, it will exit with the exit status of ENOTSUP; otherwise, it sets a flag that denies future traces. An attempt by the parent to trace a process which has set this flag will result in a segmentation violation in the parent.
I think I have a good understanding about the internals of ptrace and how it works with LLDB.
But wait! It did not help to bypass it.
Bypass ptrace
I'll use Hopper to disassemble my binary and patch it!
First, I look at symbols on the left pane:
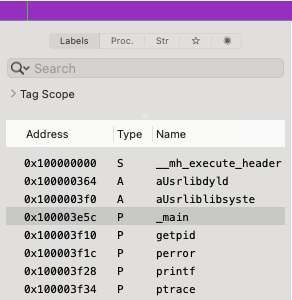
In the main functions I directly see this:
0000000100003e9c         ldr        w3, [sp, #0x10 + var_8]
0000000100003ea0         movz       w0, #0x1f
0000000100003ea4         mov        x1, x3
0000000100003ea8         movz       x2, #0x0
0000000100003eac         bl         imp___stubs__ptrace
The line movz w0, #0x1f is setting the first register to 0x1f aka 31 aka PT_DENY_ATTACH.
What if I patch the binary and set w0 to 0 aka PT_TRACE_ME, which it is used to declare
that the process expects to be traced by its parent. By doing this we ensure that:
- The
ptracecall is still valid - It won't block any debugger (as it's expected to be traced)
The final result is:
0000000100003e9c         ldr        w3, [sp, #0x10 + var_8]
0000000100003ea0         movz       w0, #0x0
0000000100003ea4         mov        x1, x3
0000000100003ea8         movz       x2, #0x0
0000000100003eac         bl         imp___stubs__ptrace
Now, I'll click on File > Produce New Executable, and rename it ptrace_anti_debug_patch!
I would like to check how LLDB will handle it that time...
❯ lldb ./ptrace_anti_debug_patch
(lldb) target create "./ptrace_anti_debug_patch"
Current executable set to '.../anti-debug/ptrace/build/ptrace_anti_debug_patch' (arm64).
... suspense!
(lldb) run
Process 1027 launched: '/Users/tonygo/temp/anti-debug/ptrace/build/ptrace_anti_debug_patch' (arm64)
Run in pid 1027
Check if debugger is attached
Debugger is not attached!
Run...
Boom!
Conclusion
While ptrace offers a straightforward way to implement anti-debugging, it's relatively easy to spot
and bypass. In the next post, we'll explore more sophisticated approaches make both detection and
bypassing significantly more challenging for reverse engineers.